Other method of plotting with Geospatial data
Folium
Folium builds on the data wrangling strengths of the Python ecosystem and the mapping strengths of the leaflet.js library. Manipulate your data in Python, then visualize it in on a Leaflet map via folium.
folium makes it easy to visualize data that’s been manipulated in Python on an interactive leaflet map. It enables both the binding of data to a map for choropleth visualizations as well as passing rich vector/raster/HTML visualizations as markers on the map.
The library has a number of built-in tilesets from OpenStreetMap, Mapbox, and Stamen, and supports custom tilesets with Mapbox or Cloudmade API keys. folium supports both Image, Video, GeoJSON and TopoJSON overlays.
Contents
Install
pip install folium
Basemap
Get your current location
import geocoder
myloc = geocoder.ip('me')
my_lat,my_lon=myloc.latlng
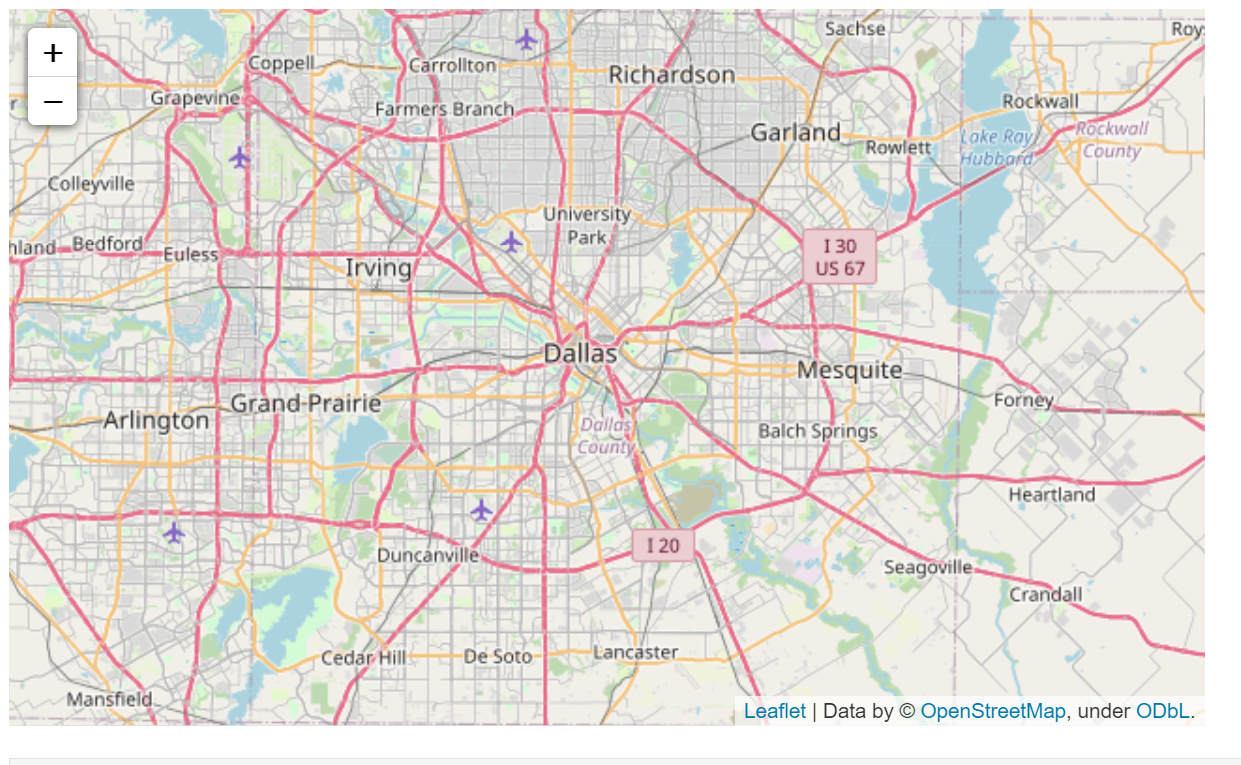
Plotting regular map
#Regular map
map = folium.Map(location=[my_lat,my_lon])
map
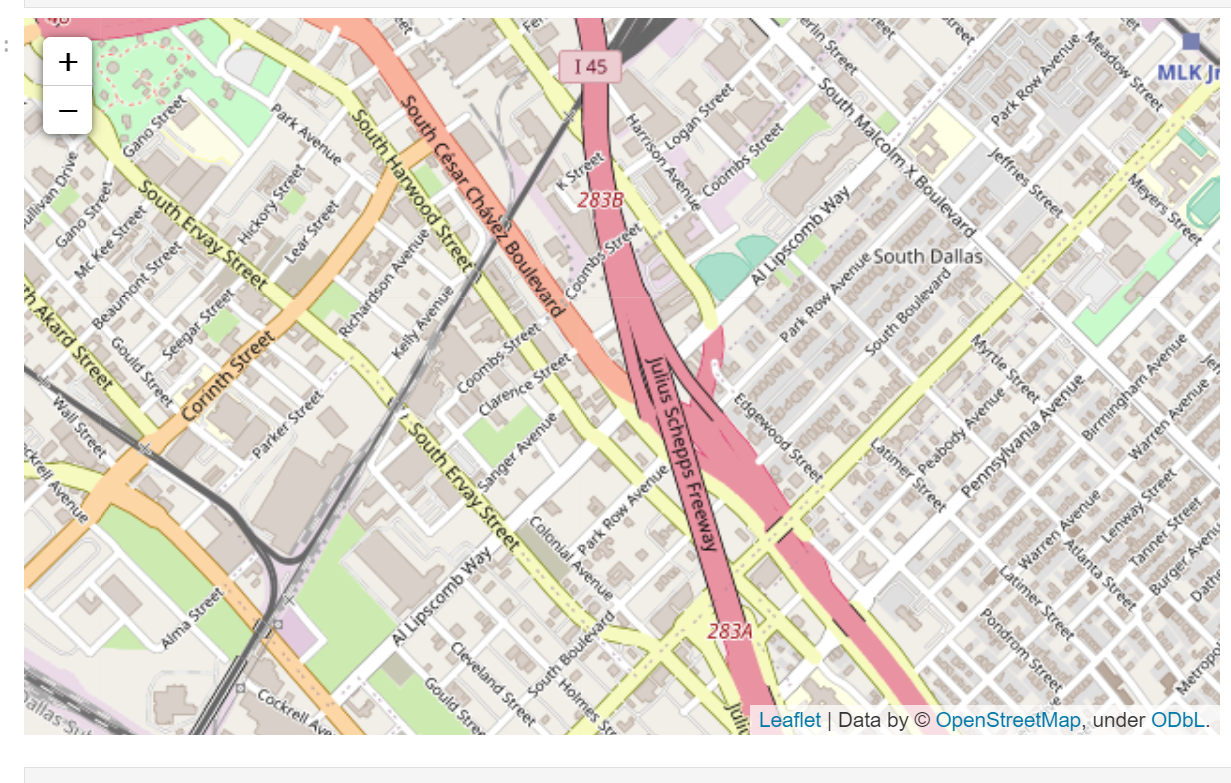
Zooming in
#Regular map
map = folium.Map(location=[my_lat,my_lon], zoom_start=15)
map
Stamen Terrain
map = folium.Map(location = [my_lat,my_lon], tiles = "Stamen Terrain", zoom_start = 9)
map
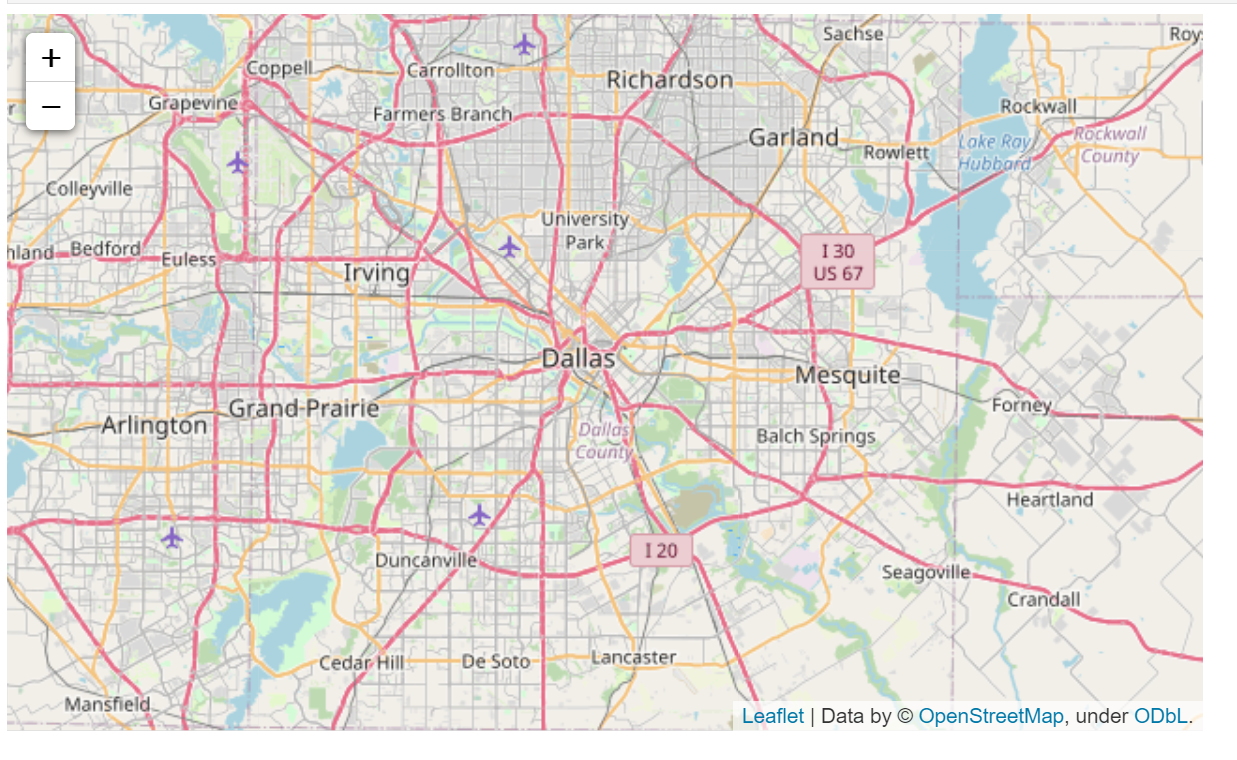
OpenStreetMap
map = folium.Map(location = [my_lat,my_lon], tiles='OpenStreetMap' , zoom_start = 10)
map
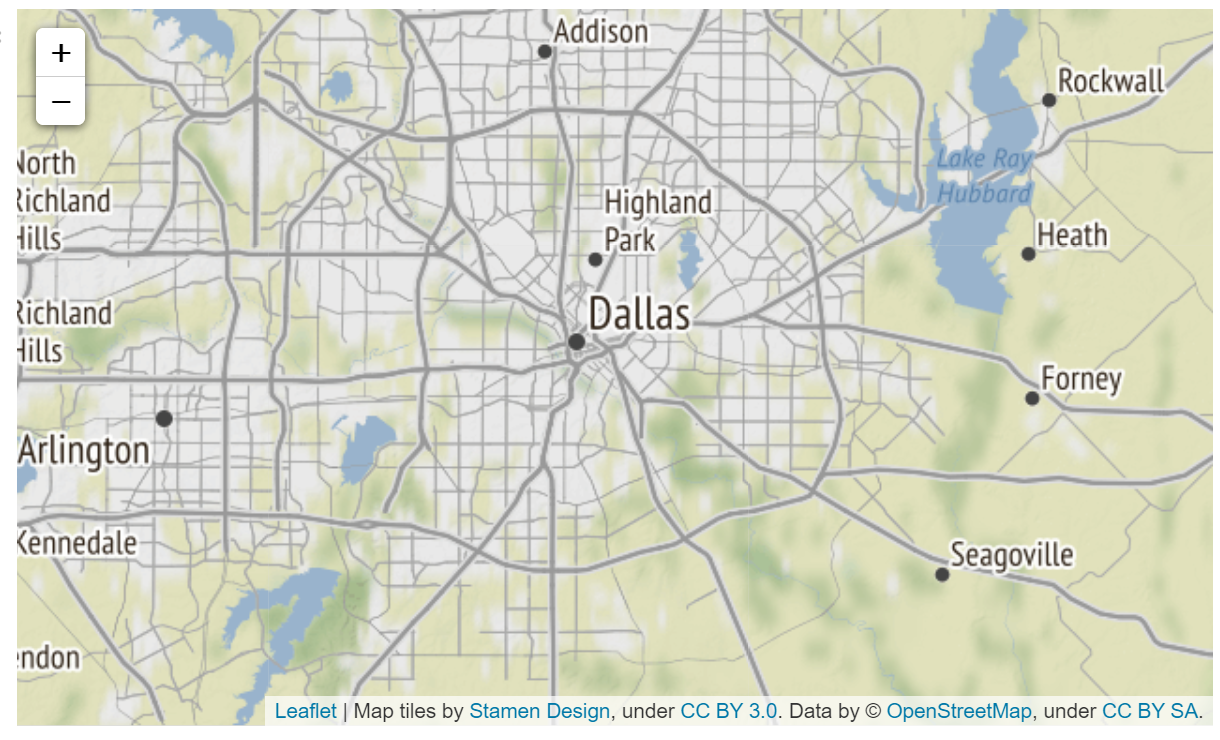
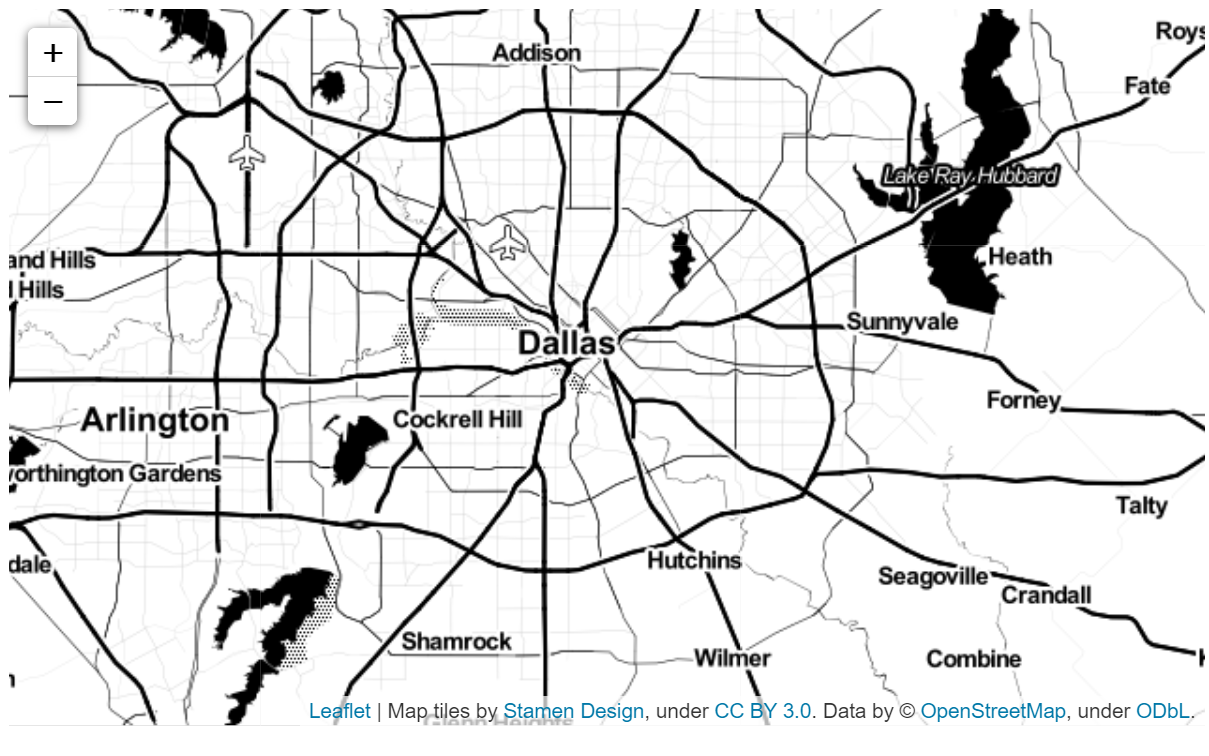
Stamen Toner
map = folium.Map(location = [my_lat,my_lon], tiles='Stamen Toner', zoom_start = 10)
map
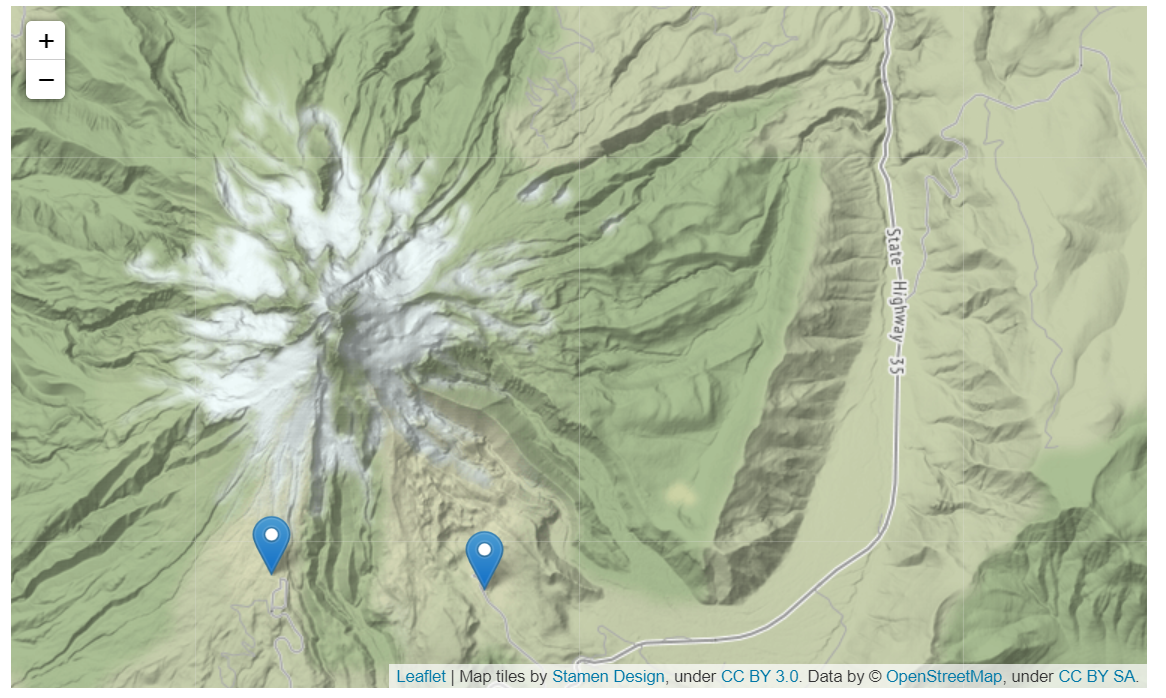
Plotting with Markers
m = folium.Map(location=[45.372, -121.6972], zoom_start=12, tiles="Stamen Terrain")

tooltip = "Click me!"

folium.Marker(
    [45.3288, -121.6625], popup="<i>Mt. Hood Meadows</i>", tooltip=tooltip
).add_to(m)
folium.Marker(
    [45.3311, -121.7113], popup="<b>Timberline Lodge</b>", tooltip=tooltip
).add_to(m)

m